Thematic Clustering of Proverbs
The Book of Proverbs is packed full of wisdom. If you've given it a read, you'll notice it's not a page turner in the typical sense. There are some distinct sections such as an Introduction, Proverbs by Solomon, the Sayings of the Wise, and more, but themes and teachings can change verse by verse or chapter by chapter.
Inspired by a graphical representation of related Wikipedia topics, I wondered: what neighbourhoods exist within Proverbs?
I had just finished a few projects on clustering techniques which spurred enough confidence to give it a shot. My goal was to find a visual representation of themes in Proverbs.
What does Proverbs look like?
Proverbs is a book from the Bible's wisdom literature and its authorship is generally attributed to King Solomon. A proverb is a short, sometimes formulaic, saying that conveys some truth through experience or common sense. This book contains a collection of these sayings in a not-so-obvious order. For example, following a common pattern of introducing a character's actions and then contrasting with the antithesis, chapter 12, verse 19 goes:
"Truthful lips endure forever, but a lying tongue is but for a moment"
and soon after in verse 24 there is a sharp topic switch,
"The hand of the diligent will rule, while the slothful will be put to forced labor"
This might work better in Hebrew, but in English, this digressive pattern can make it feel a little choppy.
About the data
The translation used for this book is the English Standard Version (ESV). This translation is easy to find online, considered more word-for-word, and required little text cleaning. Proverbs makes up 915 verses.
Other than stray whitespace, I didn't end up removing punctuation since I would be using transformer models which can reasonably understand punctuation. There are a few duplicates in Proverbs, however they were intentionally left in the dataset since a generalized clustering algorithm should group these verses in the same cluster.
Embeddings
The next step was to turn words into numbers. We do this because machine learning models don't understand words like humans do. They need words to be transformed into long lists of numbers. In this case, each verse was turned into a list of 384 numbers (or dimensions).
I was concerned if the brevity of verses (aka. less context) would impact the accuracy of the output of an embedding model. For example: a 7 word sentence with a few key words is more difficult to put in a "category" than 6 sentences talking about one topic.
I presumed a general pretrained text embedding model would be trained on paragraphs, which allow many more characters to express meaning. I ended up using the open source embedding model, sentence-transformers/all-MiniLM-L6-v2, because it was:
- Free
- Accessible in SentenceTransformers
- Trained specifically on general knowledge short sentences
What We Can Do With Embeddings?
We can make a similarity matrix that highlights (in yellow) the similarity between verses.
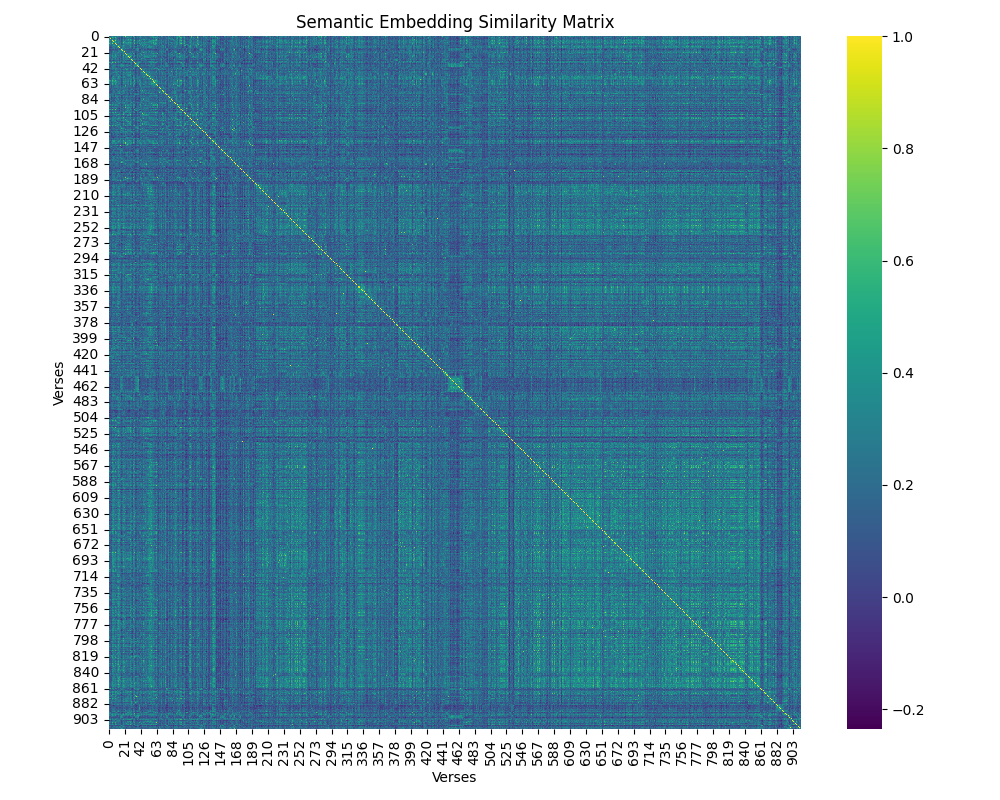
We can see that there are "squares" of yellow verses that highlight highly semantically similar verses. The yellow diagonal line has a similarity of 1 because it's a line of identical verses. Sections with a green hue indicate that the verses are somewhat related. Meanwhile, dark blue sections indicate a pair of verses that are not semantically related.
With different clustering techniques, we can use these embeddings to measure similarity and group communities of verses.
Searching For a Good Visualization
Community Graphs
The video that inspired me to do this project used the Leiden Algorithm to sort a network of nodes (articles) and edges (measure of similarity) into clusters. This algorithm essentially finds groups of nodes that are more densely packed together than to other nodes. This forms a community. I constructed the following graph by computing cosine similarity between each verse and connecting verses with cosine similarity scores over a certain threshold. Luckily, there are Python libraries that implement this algorithm so the computation was pretty easy. The algorithm identified the following communities within Proverbs:
Loading graph visualization...
This graph is fun to explore. Community 1 seems to be focused on the Wise vs. the Fool and how each character behaves. Community 12 is much smaller and features one of my favourite characters: the sluggard.
When tuning this algorithm's parameters, I noticed there were consistently disproportionately large communities such as Community 1 and 2. As well, it only ran on the largest connected network and excluded other networks, leaving out about 150 verses. This is a fun visualization, but let's move on to other ways of visualizing Proverbs' themes.
Hierarchical Clustering
A hierarchical graph is like a family tree. This graph is called a dendrogram (Greek: dendron (tree) + gramma (drawing/writing)). Using the same embeddings, I took a bottom-up approach, first grouping together the most similar pairs, and continually linking sub-groups that are similar (or rather the least different) in theme. This is called Ward's method. Luckily, Scipy has libraries for this algorithm, so it was really just plug-and-play to find a good visualization with enough sub-groups.
How to use the graph: Zoom and pan to explore. Each colored branch represents a cluster of thematically similar verses. The specificity of these themes can be adjusted with its "Height". This can be adjusted with the slider. Click on any branch node to collapse or expand it. Hover over leaf nodes to see the verse text.
Loading dendrogram visualization...
I found this visualization and algorithm helpful for finding smaller subgroups within Proverbs. For example, there are subgroups with 5-8 verses each talking about scorners, rain, birds, and patience, respectively. However, when you look at subgroups of 30+ verses, it can be harder to see the thematic connection. There are exceptions. For example, I found a major subgroup of 50+ verses with references to nature (plants, weather, animals, etc.). These are interesting and maybe with further investigation I could categorize some medium-sized subgroups. But for now, let's move on.
Kmeans Clustering
The standard and easiest method of clustering I knew was Kmeans clustering. With this algorithm, the number of clusters is predetermined and the algorithm assigns each verse to a cluster to optimize for dense clusters.
I tried 7 through 40 clusters and recorded metrics for each one. These metrics included silhouette scores which measure how good the clusters are. A low score of -1 implies the cluster is noisy and contains verses of opposite meaning while a score of +1 would indicate the verses in the cluster are near identical. Most clusters had a score of between 0.1 and 0.4. This can be explained by:
- verses being relatively short, not giving much room for high variance
- each verse in Proverbs fits into a niche subgenre of biblical proverbial text. Compare this to a novel which might talk about dozens of characters, scenes, hopes, fears, etc.
I chose a value of k=20, making 20 communities within Proverbs. This
parameter gave one of the highest silhouette score and it was a nice round
number. After inspection, the 20 clusters were generally had consistent topics.
Below is a graph of size distributions of each community. They seem to be
roughly the same size with natural outliers remaining. 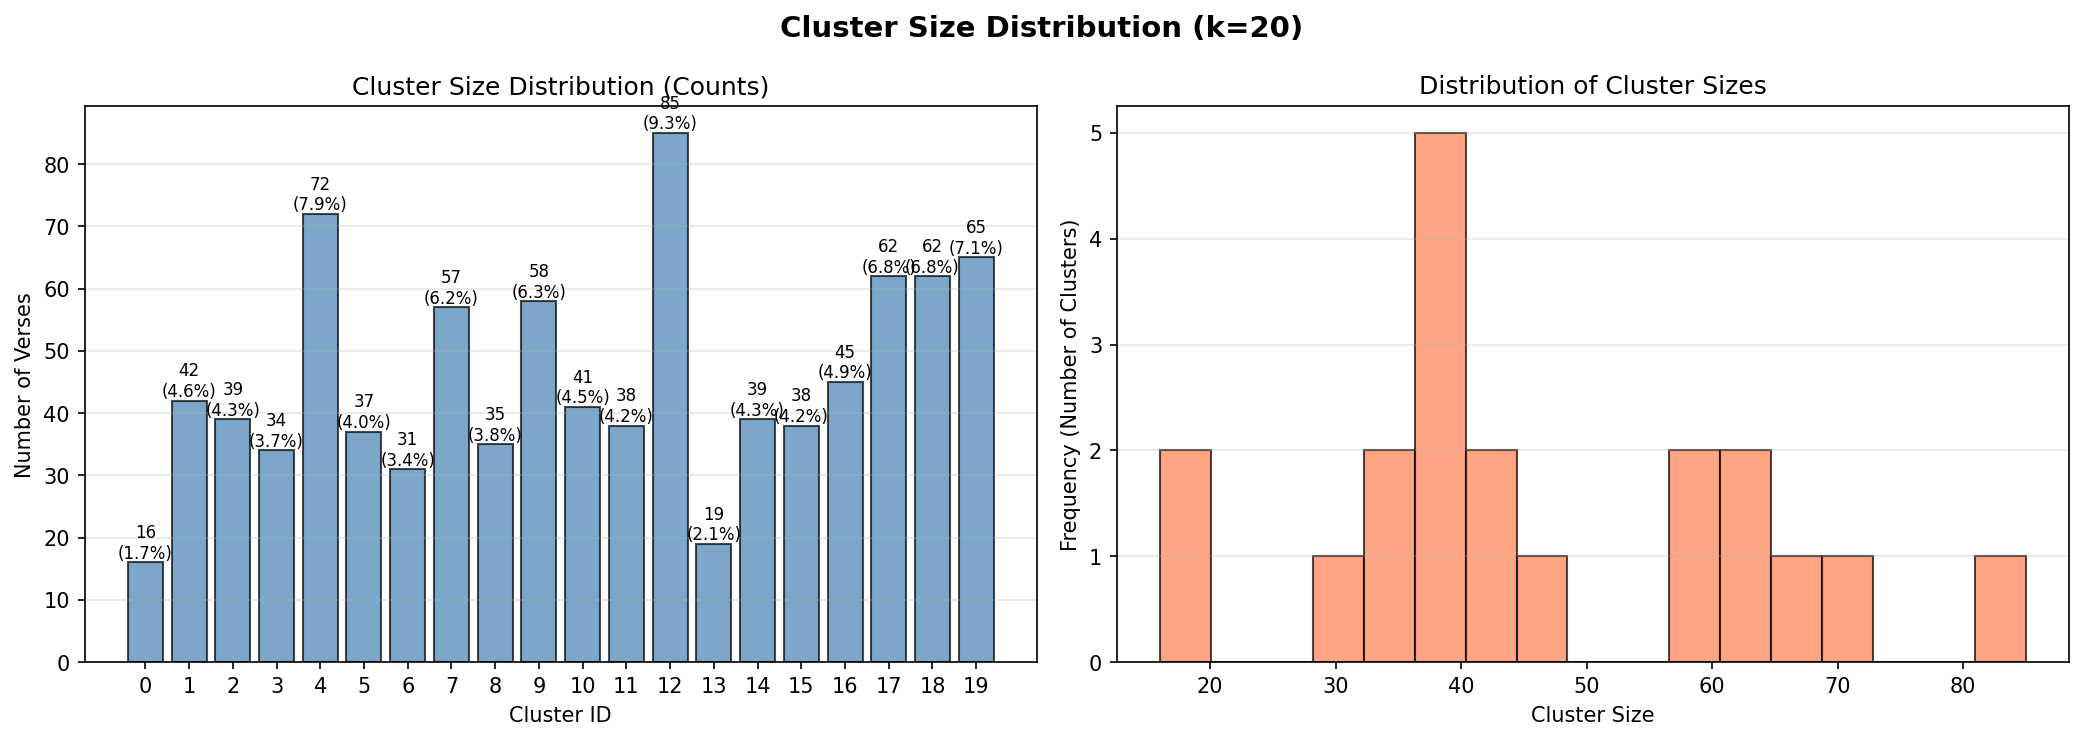
Titling Clusters
After running the kmeans algorithm, I had 20 groups of verses. I titled each group using its respective verses. Here are the methods I used and their results:
For a quick sanity check, let's see how each cluster's Claude title compares to the most frequent lexical words found in that cluster.
Next, I wanted to inspect them with a 3D visualization. I explored UMAP, which projects the 384-dimensional embeddings into 3 dimensions while trying to preserve local neighborhood structure.
Here’s the resulting 3D UMAP scatter plot:
Loading UMAP visualization...
Loading cluster explorer...
Potential Improvements
- I wanted to try this with different English translations of the Bible. However, this was a weekend project and I didn't find the time to do so.
- Near the center of Proverbs, roughly from chapter 10-29, most verses are in a "proverb format" compared to general poetic reflections on wisdom. Only clustering within this subset might have produced better visual results.
- Comparing the clustering results using different embedding models.
- Using Hebrew version of Proverbs. The Hebrew embedding space might be able to pick up intricacies lost in translation.
Limitations
This was a weekend project and the core goal was to learn some new things. If anyone reading this is inspired to dig deeper into this dataset, please feel free to reach out @sebmen7